Adding Uptime Monitor #
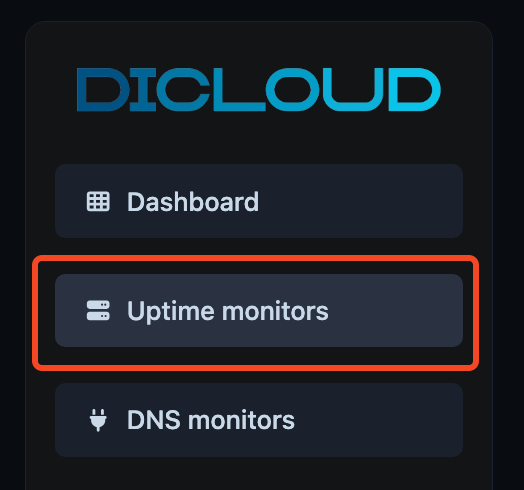
After logging in to your Dicloud dashboard, click Uptime Monitors from the left sidebar. This section lists all your uptime monitors, showing each monitor’s status, uptime percentage, and average response time.
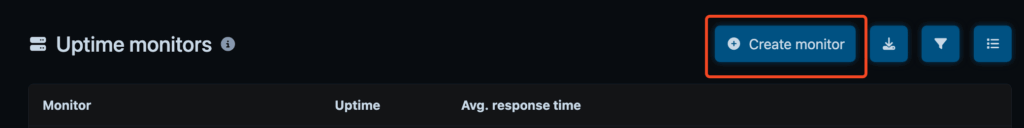
Click the Create Monitor button located in the top-right corner. You’ll be prompted to choose HTTP(s), Ping (ICMP), or Host/Port monitor, depending on what you want to track.
Adding Monitor by Type #
HTTP/HTTPS Monitor #
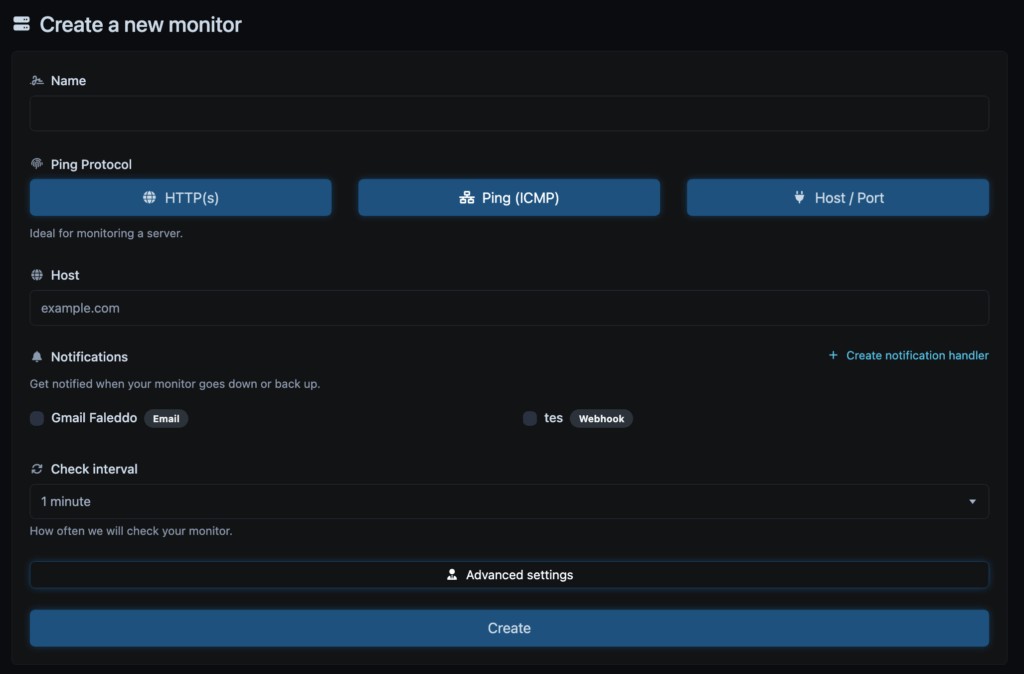
If you choose HTTP(s) as your monitor type, fill in the following fields to set up your website or API check:
- Name — Enter a clear, descriptive name for your monitor (e.g., Main Website or API Health Check).
- Ping Protocol (HTTP/S). This option is ideal for monitoring websites, APIs, and web services using standard HTTP or HTTPS requests.
- URL — Type the full URL you want to monitor, such as
https://example.com. - Notifications — Choose how you want to be alerted when your monitor goes down or comes back online.
- You can enable Email notifications or use a Webhook for external integrations.
- To add a new channel, click Create notification handler.
- Check Interval — Select how often the system should check your target. The shorter the interval (e.g., 1 minute), the faster you’ll be notified of outages.
- Advanced Settings (optional) — Configure the node checking location. You can choose to monitor only from EU nodes or from 260+ global locations for worldwide availability tracking.
- Custom Request (optional) — Use this if you need to send specific request methods (like POST or PUT), add payloads, or include custom headers.
Once all details are set, click Create to finalize the setup.
Ping (ICMP) Monitor #
If you choose Ping (ICMP) as your monitor type, fill in the following fields to start monitoring a server’s availability through network ping checks:
- Name — Enter a descriptive name for your monitor (e.g., Database Server or Main VPS Node).
- Ping Protocol — Ensure Ping (ICMP) is selected. This type is ideal for checking if a server or host is reachable via network ping.
- Host — Specify the hostname or IP address you want to monitor, such as
example.comor192.168.1.10. - Notifications — Choose how you want to be alerted when your host goes down or comes back online.
- You can enable Email notifications or integrate with Webhook for external alerting systems.
- To add a new alert channel, click Create notification handler.
- Check Interval — Define how often the system will ping your host. Common choices range from every 1 minute to every 5 minutes.
- Advanced Settings (optional) — Configure the node checking location. You can choose to run checks only from EU nodes or from 260+ global locations for multi-region uptime visibility.
Once all details are filled out, click Create to add the monitor. Your Ping (ICMP) monitor will immediately start tracking the host’s online status, and you can view its uptime history and response statistics in the Uptime Monitors list.
Host/Port Monitor #
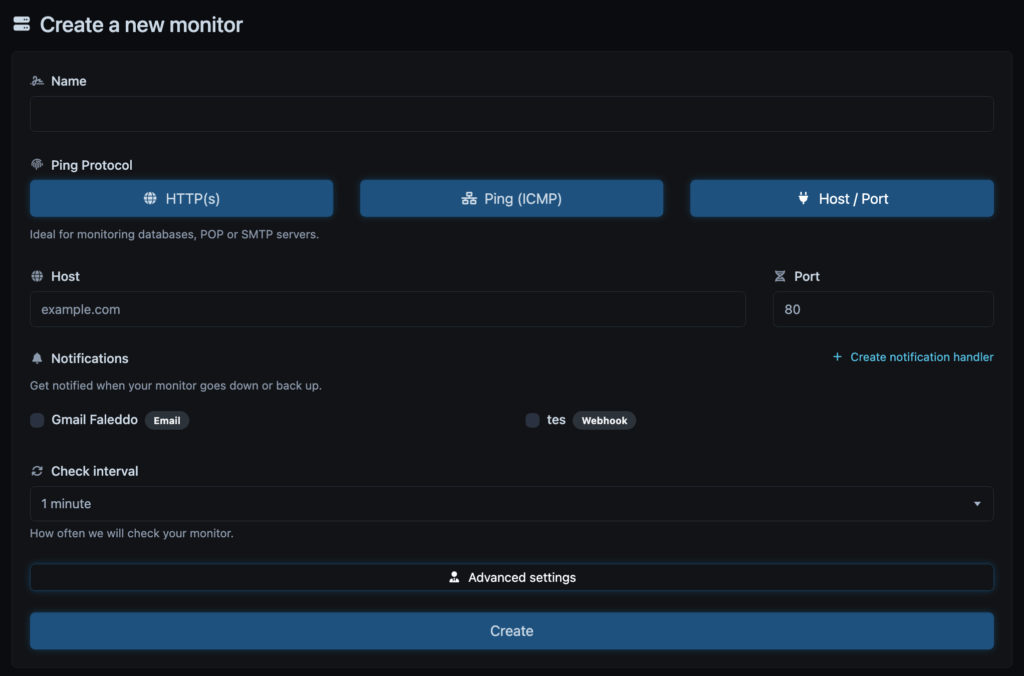
If you choose Host/Port as your monitor type, fill in the following fields to track the availability of a specific network service such as a database, POP, SMTP, or any TCP-based application:
- Name — Enter a clear, descriptive name for your monitor (e.g., MySQL Database or SMTP Server).
- Ping Protocol — Ensure Host/Port is selected. This type is ideal for monitoring services running on specific ports (e.g., 80 for HTTP, 25 for SMTP, 3306 for MySQL).
- Host — Enter the hostname or IP address of your server (for example,
example.comor10.0.0.5). - Port — Specify the port number associated with the service you want to monitor.
- Notifications — Choose how you want to be alerted when the host or service goes down or comes back online.
- You can enable Email notifications or configure Webhook for integration with other systems.
- To add a new channel, click Create notification handler.
- Check Interval — Set how frequently the monitor will perform checks (e.g., every 1 minute for real-time monitoring).
- Advanced Settings (optional) — Configure the node checking location. You can choose to monitor only from EU nodes or from 260+ global locations for worldwide uptime visibility.
Once done, click Create to activate the monitor. Your new Host/Port monitor will start checking the connection status to the specified host and port, giving you continuous insights into your service’s uptime and availability.
