Table of Contents
Status Pages allow you to share real-time uptime and service health with your users, clients, or internal teams. They serve as public (or private) dashboards that visualize the operational status of your monitors to help you maintain transparency, build trust, and reduce support inquiries during incidents.
Step 1: Navigate to Status Pages #
From the left sidebar, open Status Pages. This section lists all the existing public or internal status pages you’ve created.
To add a new one, click Create Status Page in the top-right corner.

Step 2: Create a New Status Page #
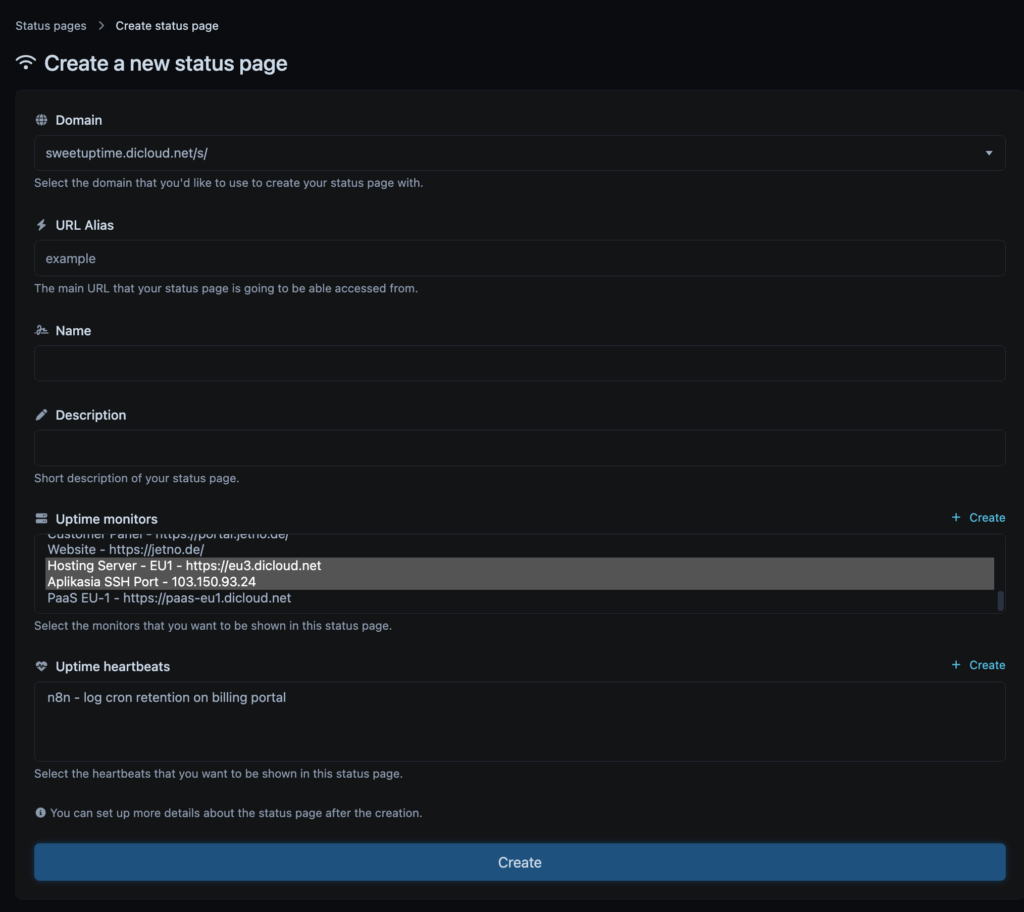
After clicking Create Status Page, fill out the form as follows:
- Domain — Choose the base domain for your status page.
- Example:
sweetuptime.dicloud.net/s/ - or you can choose from custom domain you’ve added before
- Example:
- URL Alias — Define a short, custom alias for the page (e.g.,
examplewill createsweetuptime.dicloud.net/s/example). - Name — Enter a clear name for your status page (e.g., Dicloud Global Services or Customer Systems Health).
- Description — Provide a brief summary of what this status page represents (e.g., “Live status of our hosting servers, apps, and API endpoints”).
- Uptime Monitors — Select one or more uptime monitors you want to display on this page (for example,
Website - https://jetno.de/,Hosting Server - EU1).- Click Create next to this field if you need to add a new uptime monitor first.
- Uptime Heartbeats — Optionally include Cronjob monitors (heartbeats) to display background task health (e.g., scheduled API jobs, billing syncs).
- Visibility Settings (available after creation) — Once the status page is created, you can configure whether it’s Public (accessible to anyone) or Private (restricted access for internal use).
s
