Step 1: Navigate to Server Monitors
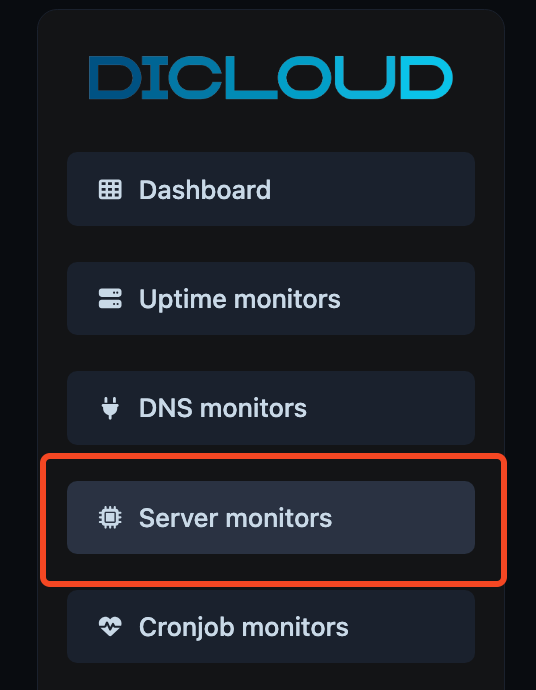
From the left sidebar, go to Server Monitors. Here you can view all servers currently being tracked, along with their latest metrics and alert statuses.

To create a new one, click Create Server Monitor in the top-right corner.
Step 2: Create a New Server Monitor
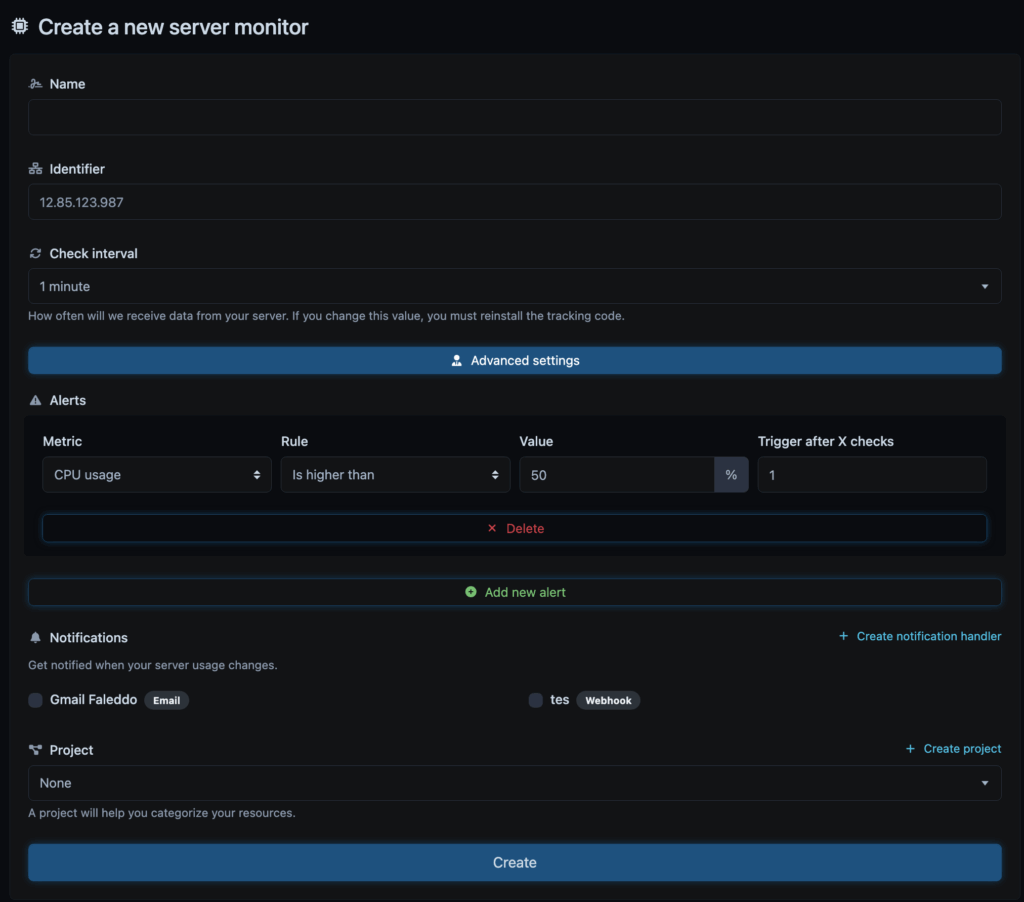
After clicking Create Server Monitor, fill out the setup form as follows:
- Name: Enter a recognizable name for your server (e.g., Production Web Node 1 or DB Server Singapore).
- Identifier: Specify your server’s unique identifier (typically its public IP address). This value will be used by the tracking code to report metrics back to SweetUptime.
- Check Interval: Choose how often SweetUptime should receive data from your server. If you change this interval later, you’ll need to reinstall or update the tracking code on the server.
- Alerts: Define the performance thresholds that should trigger alerts.
- Metric: Choose what to monitor (e.g., CPU usage, Memory usage, Disk usage).
- Rule: Define the condition (e.g., is higher than, is lower than).
- Value: Set the numeric threshold (e.g., 50% CPU usage).
- Trigger after X checks: Determine how many consecutive checks must meet the condition before sending an alert.
- Click Add new alert to monitor multiple metrics.
- Notifications: Select how you want to be alerted when an alert condition is met.
- Use Email or Webhook notifications.
- To add a new alert channel, click Create notification handler.
- Project (optional): Assign this monitor to a project to better organize your servers by environment or team.
- Create on Create button.
Step 3: Finalize and Install
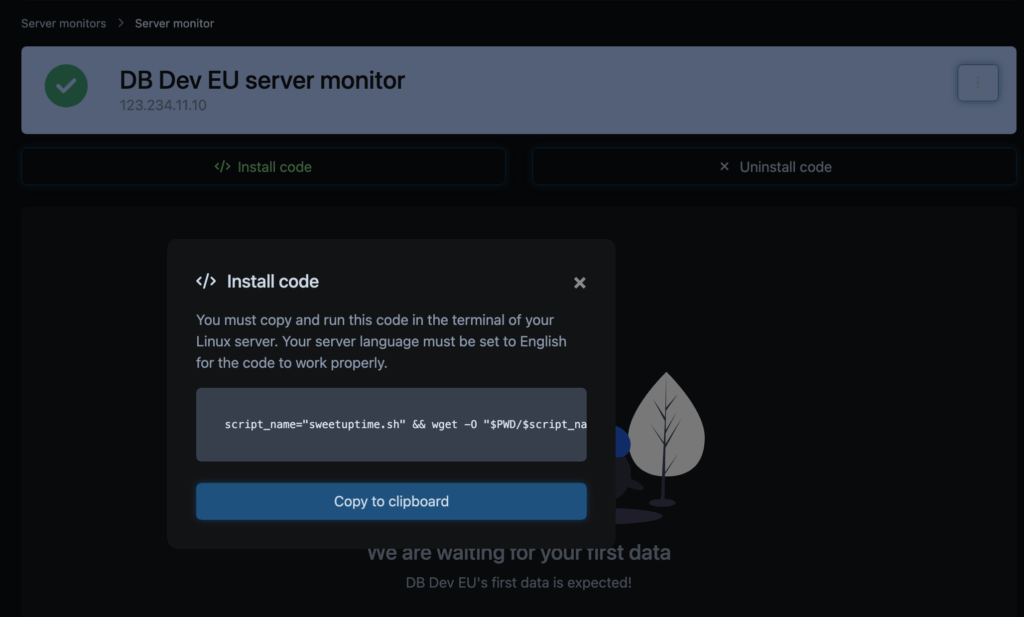
To activate monitoring:
- Copy the snippet provided after creation.
- Access your server via SSH (for example:
ssh root@your-server-ip). - Paste and run the snippet directly in your terminal.
This script installs the SweetUptime agent and automatically starts sending metrics to your dashboard.

Tip: Keep your SSH session open until installation completes. Once done, data from your server should begin appearing in the dashboard within the next check interval.
