After logging into SweetUptime, you’ll be greeted with the Dashboard, your central hub to monitor every website, server, or service you’re tracking. It provides an instant overview of uptime, response time, and current health for all your monitors.
Uptime Monitors #
This section lists your website and API uptime monitors. It shows availability and response time for each endpoint.
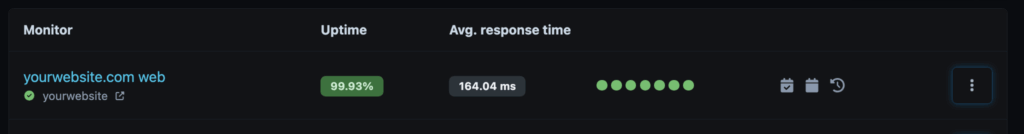
Example: yourwebsite.com shows 99.93% uptime and 168 ms response time -> indicating good stability with minor downtime events.
| Column | Description |
|---|---|
| Monitor | The name and URL of the monitored website or API. |
| Uptime | The overall percentage of time the service stayed online. |
| Avg. Response Time | Average response latency measured during recent checks. |
| Health Indicators | Visual dots showing recent uptime trends (green = up, red = down). |
| Reports / Logs | Access historical uptime, downtime, or performance charts. |
| Actions (⋮) | Edit, pause, or delete the monitor. |
Latest Cronjob Monitors #
Used for monitoring scheduled background jobs (cronjobs) to mek sure they run successfully and on time.
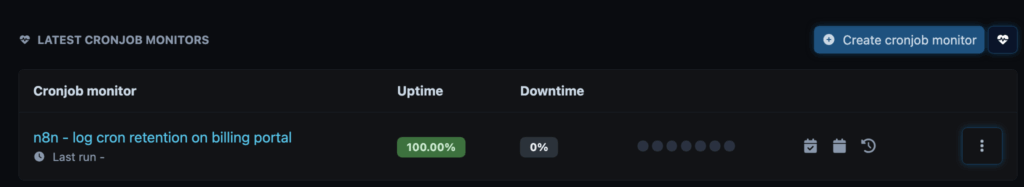
Example: n8n – log cron retention on billing portal has 100% uptime. Every scheduled job ran without failure.
| Column | Description |
|---|---|
| Cronjob Monitor | The name or description of the cron task being tracked. |
| Uptime | Percentage of successful executions. |
| Downtime | Percentage or count of failed or missed runs. |
| Health Indicators | Shows the last few job results (green = success, red = failure). |
Latest Domains #
Monitors your registered domains for Whois expiration and SSL certificate validity. This monitor helps you avoid downtime caused by expired assets.
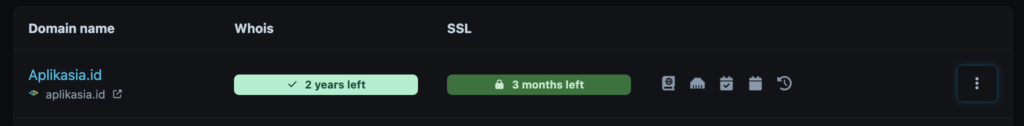
Example: aplikasia.id -> Whois valid for 2 years, SSL expires in 3 months. SweetUptime automatically re-checks expiration dates daily.
| Column | Description |
|---|---|
| Domain Name | The domain being monitored (click to open). |
| Whois | Shows how long until the domain registration expires. |
| SSL | Displays days or months left until SSL certificate expiration. |
| Last Checked | Indicates when the domain and SSL were last verified. |
| Actions (⋮) | Manage or remove domain monitoring. |
Latest DNS Monitors #
Tracks DNS propagation, record consistency, and change frequency.
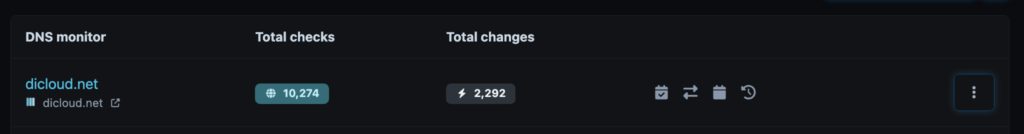
Example: dicloud.net has 10,274 checks and 2,292 changes detected -> indicating active DNS updates across servers.
| Column | Description |
|---|---|
| DNS Monitor | The domain or hostname being tracked. |
| Total Checks | Total DNS checks performed since setup. |
| Total Changes | Number of record updates or differences detected. |
| Reports / Logs | Access DNS change history and trend graphs. |
Latest Server Monitors #
Provides real-time visibility into your server performance including CPU, RAM, and disk usage.
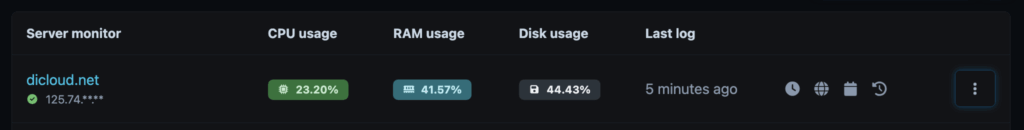
Example: dicloud.net -> CPU 23.20%, RAM 41.57%, Disk 44.43%, last updated 5 minutes ago.
| Column | Description |
|---|---|
| Server Monitor | The hostname or IP address of your monitored server. |
| CPU Usage | Current CPU load percentage. |
| RAM Usage | Percentage of memory currently used. |
| Disk Usage | Storage utilization across available disks. |
| Last Log | Timestamp of the latest health report. |
Latest Status Pages #
Shows all public status pages you’ve created where users can check your uptime transparency.
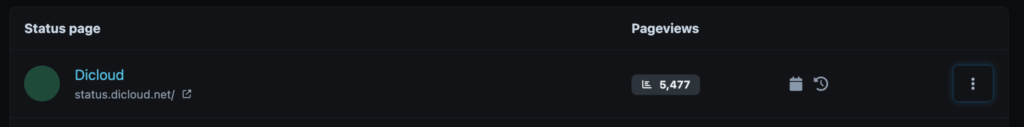
Example: status.dicloud.net -> public uptime page for Dicloud, viewed 5,477 times.
| Column | Description |
|---|---|
| Status Page | The name and public URL of your hosted status page. |
| Pageviews | Number of visitors or views for the page. |
| Actions (⋮) | Edit, view, or delete a status page. |
